
Farm Monitoring & Record Keeping
Farm monitoring and record keeping is the systematic and ongoing process of observing, measuring, and documenting all aspects of your agricultural operations. This includes tracking soil health indicators, crop performance, livestock health, weather patterns, financial transactions, and input usage. It provides the essential data to understand your farm's dynamics, make informed decisions, adapt management practices, and track progress towards regenerative goals.
Read More: Complete Description
Farm monitoring and record keeping is the foundational practice that underpins all successful regenerative agriculture transitions. It's not merely about collecting data; it's about gaining a deep, actionable understanding of your unique farming system and its interaction with the environment. By meticulously observing, measuring, and documenting various aspects of your operation, you create a knowledge base that empowers informed decision-making, allows for adaptive management, and provides tangible proof of progress toward regenerative goals. This practice transforms assumptions into insights, enabling farmers and ranchers to move beyond conventional practices and embrace more ecologically sound and economically resilient methods.
The scope of farm monitoring and record keeping is broad, encompassing everything from the microscopic life in your soil to the macro-economic health of your farm business. Key areas include:
- Soil Health: Tracking organic matter, aggregate stability, infiltration rates, earthworm populations, pH, nutrient levels, and compaction.
- Crop Performance: Recording planting dates, varieties, germination rates, growth stages, pest and disease incidence, weed pressure, yield, and quality.
- Livestock Health & Performance: Monitoring animal health, weight gain, reproduction rates, feed conversion ratios, grazing impacts, and manure distribution.
- Environmental Factors: Recording rainfall, temperature, wind, humidity, growing degree days, and solar radiation.
- Inputs: Documenting all fertilizer, pesticide, herbicide, seed, feed, and water usage, including sources and application rates.
- Operations: Tracking tillage events (even if accidental or transitional), planting, harvesting, irrigation, and other machinery operations.
- Financials: Recording all expenses, revenues, labor costs, capital investments, and grants.
This practice is foundational for regenerative agriculture. It directly supports and informs the application of all five regenerative principles. Without robust monitoring, it's impossible to know if soil disturbance is truly minimized, if crop diversity is genuinely increasing, if soil cover is consistently maintained, if living roots are present for sufficient durations, or if livestock integration is achieving the desired ecological benefits. For instance, tracking soil respiration rates helps gauge biological activity, confirming that leaving soil undisturbed is fostering life. Monitoring plant phenology reveals opportunities to extend living root presence through cover crops, directly supporting Principle 4. Similarly, observing how different grazing intensities affect pasture regrowth and soil surface cover proves or disproves the effectiveness of adaptive grazing (Principle 5).
Common misconceptions about record keeping include it being overly burdensome, overly complex, or only for large operations. In reality, digital tools and streamlined approaches make it more accessible than ever. For small farms, a simple notebook and camera might suffice. For larger operations, software platforms offer powerful, integrated solutions. The key is consistency and adaptability—records should serve the farmer, not the other way around. The purpose is insight, not just compliance.
The international applicability of farm monitoring and record keeping is universal. Farmers in Ukraine track wheat yields and soil conditions; rice farmers in Southeast Asia monitor water levels and nutrient cycling; pastoralists in East Africa record rainfall and rangeland health; cattle ranchers in Brazil track pasture growth and animal performance; mixed farmers in Australia monitor diverse crop rotations and soil moisture. The 'what' and 'how' might vary by region, climate, and enterprise, but the imperative to observe, measure, and record data to guide decisions remains constant. For example, a dryland farmer in Australia might meticulously record rainfall events and subsequent soil moisture levels to optimize wheat planting windows, while a farmer in a humid subtropical climate (like the southeastern US) might track disease pressure and canopy cover for disease management.
Transitioning to regenerative agriculture often requires a more focused and intensified monitoring regime. During transition, farmers need to track the impact of changes much more closely. For instance, when reducing synthetic inputs, monitoring soil biology, nutrient levels, and crop performance becomes critical to ensure the transition is supported by increasing soil health, rather than leading to yield crashes. This intensive monitoring acts as an early warning system and provides the data needed to adjust management practices incrementally.
Ultimately, farm monitoring and record keeping is a continuous learning process. It allows farmers to become their own best researchers, understanding the intricate connections within their unique ecosystems. By dedicating time to observe and record, farmers generate the intelligence needed to refine regenerative practices, optimize resource use, enhance profitability, and build resilient, healthy landscapes for the future.
Sources behind this view
Sources behind this view
 Videos & Podcasts
-
Regenerative agriculture provides solutions for climate change, human health, and soil degradation, contrasting with industrial agriculture's harmful impacts, including glyphosate use. Practices like
-
Transitioning to regenerative agriculture is a human/psychological process requiring trials to reduce risk and build trust. Increased consumer awareness of ecology and health would drive demand for re
-
Case studies of farmers like Duane Beck, Kofi Boa, David Brandt, and Gabe Brown demonstrate that regenerative agriculture (no-till, cover crops, diverse rotations) significantly increases soil health,
-
Adopting regenerative practices should start small and incrementally, focusing on soil health over short-term yields. Collaboration, strategic nutrient sourcing, and leveraging resources like Continuu
 Research
-
Systematic review of regenerative farming: Addressing agricultural sustainability challenges (opens in new window)
This study found: Systematic review of 31 studies shows regenerative farming improves soil health, biodiversity, and carbon capture, aiding sustainability. Technology is key for adoption, but policy, farmer understandi
-
Regenerative Agriculture: Restoring Ecosystems¢ Resilience and Productivity: A Review (opens in new window)
This study found: Regenerative agriculture builds soil health and ecosystem services through practices like no-till, cover crops, and diverse rotations. It increases soil organic matter, improves water infiltration, bo
-
The Indigenous Roots of Regenerative Agriculture (opens in new window)
This study found: Modern regenerative agriculture practices are rooted in millennia of Indigenous land stewardship, offering profound knowledge and a crucial value system of respect and reciprocity for true transformat
-
Transition to Regenerative Farming (opens in new window)
This study found: A 5-year case study shows a farm successfully transitioned to regenerative practices, reducing soil erosion and increasing wildlife by using cover crops, diversified rotations, and reduced tillage. Pr
Key Points
What It Is
- Ongoing observation and data collection
- Tracks soil, crop, livestock, environment, finance
- Essential for informed decision-making
- Provides evidence of system changes
Why Do It
- Reveals farm system dynamics
- Guides adaptive management strategies
- Tracks progress toward regenerative goals
- Supports all five regenerative principles
Know the Debate
- Monitor costs vary by scale: $13-1000+/ha ($5-400+/acre)
- Labor: 2.5-15 hours/week informs decisions efficiently
- Transition value visible in 1-2 years, full benefits take 3-7 years
- Records link soil health to financial and ecological gains
Benefits - Financial
- Input cost savings of 15% to 25% via precise management.
- Yield optimization increases annual revenue by $52 to $156 per acre ($128–$385 per hectare).
- Captures 5% to 15% price premiums through verified regenerative record-keeping.
Benefits - System
- Soil erosion reduction: 60-85% decrease
- Water infiltration +40-70% over decade
- Soil organic matter increase: 0.5-1.5% per year
- Supports Principles 1,2,3,4,5 via data
Risks - Financial
- Unused data results in annual overhead loss of $52 to $156 per acre ($128–$385 per hectare).
- Transition-related yield dips reduce revenue by $42 to $104 per acre ($104–$257 per hectare).
- High labor opportunity costs range from $208 to $832 per acre ($514–$2,056 per hectare).
Risks - System
- Inaccurate or incomplete data
- Data overload without analysis
- Failure to adapt based on findings
- Record keeping becomes burden, not tool
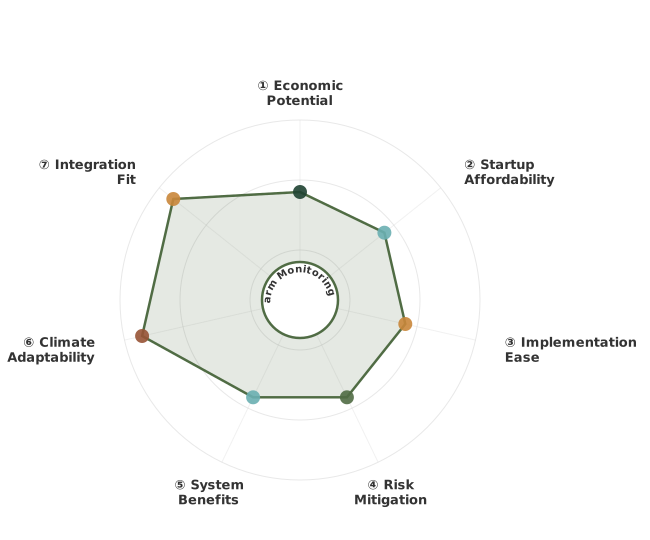
How These Traits Are Calculated
Trait dimensions are ordered clockwise starting from the top of the chart (12 o'clock position):
1. Economic Potential
Financial returns, annual value, and break-even timeline
WHAT: Evaluates financial viability by combining net annual value ($/ha from savings, income, and amortized harvests) with break-even timeline showing when practices pay for themselves.
WHY: Farmers need clear ROI understanding before committing resources. Fast payback (≤3 years) with strong returns (≥$300/ha) enables confident adoption, while long timelines (>10 years) restrict adoption to well-funded operations willing to wait for returns.
HOW: Calculated from net annual value in $/ha and break-even years. Exceptional (≥2.6): fast ROI ≤3 years + high value ≥$300/ha. Typical (1.8-2.5): moderate returns or longer timelines. Limited (<1.8): marginal economics or very long payback >10 years.
2. Startup Affordability
Initial investment costs and financial barrier to entry
WHAT: Measures financial barrier to entry through startup costs for equipment, infrastructure, consulting, and materials. Inverted scoring: lower costs = higher scores = more accessible adoption.
WHY: Affordability determines who can adopt. Low-cost practices (<$250/ha) enable widespread adoption across diverse scales, while high costs (>$2,500/ha) limit adoption to well-capitalized operations, creating barriers that slow regenerative transition.
HOW: Calculated from initial investment parsed from practice content. Inverted scoring: Exceptional (≥2.6): minimal investment <$250/ha. Typical (1.8-2.5): moderate costs $250-2,500/ha. Limited (<1.8): high barrier >$2,500/ha.
3. Implementation Ease
Learning curve and specialized knowledge required
WHAT: Measures how much learning, planning, and specialized knowledge a practice requires. Simpler practices with fewer steps score higher, while complex practices requiring extensive training or specialized resources score lower.
WHY: Complex practices create adoption barriers even when economically viable. Straightforward practices enable faster adoption and broader participation, while those requiring extensive training, timing precision, or specialized equipment limit who can succeed.
HOW: Evaluated by measuring documentation length and identifying complexity markers like location-specific requirements, seasonal timing windows, specialized skills, and dedicated equipment needs. Exceptional (≥2.6): straightforward practices with minimal prerequisites. Typical (1.8-2.5): moderate learning curve with some specialized needs. Limited (<1.8): steep learning curve requiring significant training or resources.
4. Risk Mitigation
Identified financial and ecological risk assessment
WHAT: Evaluates documented risks across financial (investment loss, market volatility) and ecological (crop failure, pest outbreaks) domains. Inverted scoring: fewer risks = higher scores.
WHY: Understanding risk exposure helps farmers make informed decisions. Low-risk practices allow confident implementation, while high-risk practices require careful planning and contingency resources. Risk transparency prevents costly failures.
HOW: Calculated from identified risks in practice content. Inverted scoring: Exceptional (≥2.6): ≤2 risks with manageable severity. Typical (1.8-2.5): 3-5 moderate risks. Limited (<1.8): 6+ risks or severe exposure.
5. System Benefits
How many ways the practice improves your land simultaneously
WHAT: Measures how many aspects of land health improve at once—carbon storage, soil quality, erosion control, water absorption, and biodiversity. Practices that improve multiple areas simultaneously create compounding benefits where each improvement reinforces the others.
WHY: The best practices solve multiple problems at once. For example, addressing erosion simultaneously builds carbon and improves water infiltration, creating a resilient system with positive feedback loops. Single-benefit approaches miss these compound transformation opportunities.
HOW: Evaluated across five key outcomes: carbon sequestration, soil organic matter increase, erosion reduction, water infiltration improvement, and biodiversity enhancement. Exceptional (≥2.6): high carbon storage (>8 t/ha/yr), improvements across 4-5 areas, transformative outcomes. Typical (1.8-2.5): moderate carbon (3-8 t/ha/yr), improvements across 2-3 areas. Limited (<1.8): modest impact (<3 t/ha/yr), single-area focus only.
6. Climate Adaptability
Geographic applicability across Köppen climate zones
WHAT: Evaluates geographic applicability by assessing how many Köppen climate zones successfully support a practice and what adaptation requirements are needed. Measures breadth of climates where farmers can implement with minimal to moderate modifications.
WHY: Universal practices working across diverse climates enable more farmers to adopt regenerative approaches. Practices limited to single climate types (only Mediterranean, only tropical) restrict adoption and slow global transition. Adaptability determines whether a practice serves niche regions or offers broad transformation.
HOW: LLM evaluation of regional success stories, Köppen zone coverage, and adaptation needs. Exceptional (≥2.6): 5+ zones or 4+ climate types, 3+ continents, minimal adaptation. Typical (1.8-2.5): 3-4 zones or 2-3 types, 2 continents, moderate adaptation. Limited (<1.8): 1-2 zones, single region, significant adaptation or highly specialized.
7. Integration Fit
How well this practice combines with others you're doing
WHAT: Measures how well a practice combines with other regenerative practices you might be doing. Some practices work as building blocks that make many other practices easier or more effective, while others work best on their own.
WHY: Practices that combine well with many others create more value on your farm. For example, cover cropping enables no-till, improves grazing, supports crop diversity, and helps water management—making all of them work better together. This helps you build a coherent system rather than juggling disconnected practices.
HOW: Evaluated by identifying which practices combine well and how strong those combinations are. 'Ideally Suited' means strong combinations where practices reinforce each other (practice A makes B easier, while B makes A more effective). 'Adequate' means complementary benefits that work well together. Exceptional (≥2.6): combines well with 6+ practices, serves as a building block. Typical (1.8-2.5): combines with 3-5 practices. Limited (<1.8): 1-2 practices or works best alone.
Going Deeper
1
WHY - The Benefits
Farm monitoring and record keeping serves as the central nervous system of a regenerative farm, providing the awareness and insight needed to steer operations toward desired ecological and economic outcomes. Without consistent, accurate data, progress in regenerative...
Farm monitoring and record keeping serves as the central nervous system of a regenerative farm, providing the awareness and insight needed to steer operations toward desired ecological and economic outcomes. Without consistent, accurate data, progress in regenerative agriculture is difficult to measure, and blind spots can lead to costly mistakes. This practice offers a multitude of benefits, impacting soil health, economic viability, water cycle efficiency, carbon sequestration, biodiversity, and resilience.
WHY - The Benefits
Farm monitoring and record keeping serves as the central nervous system of a regenerative farm, providing the awareness and insight needed to steer operations toward desired ecological and economic outcomes. Without consistent, accurate data, progress in regenerative...
Farm monitoring and record keeping serves as the central nervous system of a regenerative farm, providing the awareness and insight needed to steer operations toward desired ecological and economic outcomes. Without consistent, accurate data, progress in regenerative agriculture is difficult to measure, and blind spots can lead to costly mistakes. This practice offers a multitude of benefits, impacting soil health, economic viability, water cycle efficiency, carbon sequestration, biodiversity, and resilience.
Soil Health Benefits
Accurate soil monitoring allows farmers to track the direct impact of their management decisions on soil biological, chemical, and physical properties. For example, consistently measuring soil organic matter (SOM) over 5-10 years can reveal if cover cropping, reduced tillage, or compost applications are effectively building soil carbon. An increase of 0.1-0.5% SOM per year is a strong and realistic indicator of improving soil health in many systems. Similarly, tracking water infiltration rates can quantify the effectiveness of practices that improve soil structure, showing improvements of 40-70% over a decade of regenerative management.
Monitoring earthworm populations—a key indicator of soil biological health—can show a resurgence from near zero in degraded soils to 5-10 or more per shovelful within 3-5 years of regenerative practices. Tracking aggregate stability (e.g., using the slake test) reveals improved soil structure, with stable aggregates increasing from 20-30% to over 60-80% in well-managed regenerative systems within 7-10 years. These quantitative measures provide tangible proof that regenerative practices are creating a healthier, more resilient soil ecosystem.
Understanding soil pH and nutrient availability through regular testing allows for a reduction in synthetic inputs. As soil biology improves, it becomes more efficient at cycling nutrients, reducing the need for costly and potentially harmful external applications. Record keeping helps pinpoint specific deficiencies or excesses, enabling precise, targeted nutrient management rather than broad-spectrum applications. This leads to more efficient nutrient use and a healthier soil environment, as documented by soil tests showing reduced reliance on synthetic fertilizers and a more balanced nutrient profile.
Economic Benefits
The financial benefits of diligent record keeping in regenerative agriculture are substantial and accrue over time. By tracking input usage (fertilizers, pesticides, fuel, feed), farmers can identify areas for cost reduction. For example, improved soil fertility from regenerative practices can lead to a 15-30% reduction in synthetic fertilizer costs within 5-7 years. Similarly, healthier crops require fewer pesticide applications, potentially saving $50-200 per hectare ($20-80 per acre) annually USD equivalent.
Yield optimization is another key economic outcome. While regenerative systems might see a temporary dip during transition, proactive monitoring allows farmers to identify issues and adapt management to harness the improved soil health, leading to 10-20% yield increases in crops and livestock over 5-10 years compared to their own pre-transition baseline. This improved productivity, combined with lower input costs, enhances profitability and resilience.
Risk mitigation is perhaps the most significant economic benefit. Early detection of pest outbreaks, disease development, or soil issues through monitoring allows for timely intervention, preventing minor problems from becoming major, costly crises. For example, spotting early signs of a fungal disease might mean a single targeted organic spray saves a crop that would otherwise be a total loss. This proactive approach can save $300-1000 per hectare ($120-400 per acre) annually USD equivalent by preventing catastrophic losses.
Furthermore, robust records can provide auditable data for accessing premium markets, certifications (e.g., organic, regenerative certification), or government incentive programs focused on ecosystem services. Demonstrable improvements in soil carbon, biodiversity, or water quality can unlock new revenue streams or grants, creating economic advantages that are directly supported by reliable data.
Regenerative Systems Fit
Farm monitoring and record keeping is the lynchpin of any successful regenerative agriculture system, essential for guiding and validating the application of all five regenerative principles:
- Principle 1: Minimize Soil Disturbance: Monitoring confirms that tillage events are absent or infrequent and that soil structure is improving (e.g., through increased aggregate stability or earthworm activity), validating reduced disturbance. It also helps identify sources of unintended compaction (e.g., traffic patterns) for correction.
- Principle 2: Maximize Crop Diversity: Record keeping tracks the diversity of cash crops, cover crops, and associated species (hedgerows, pollinator strips), ensuring they are increasing complexity above and below ground. It helps in planning diverse rotations and cover crop mixes tailored to specific needs.
- Principle 3: Keep Soil Covered: Monitoring documents periods of bare soil, reveals opportunities to extend cover cropping, and verifies the presence of mulch layers or living canopies, ensuring the soil surface is protected year-round.
- Principle 4: Maintain Living Roots: Tracking planting and termination dates for cash crops and cover crops allows for maximizing the duration of living roots in the soil, extending photosynthesis and biological activity throughout the year.
- Principle 5: Integrate Livestock: Monitoring helps plan rotational grazing, track pasture recovery rates, assess animal impact on soil and vegetation, and quantify the nutrient cycling benefits of livestock integration, ensuring animals are managed to build soil health.
For farms in transition, intensive monitoring is crucial. When reducing synthetic inputs, tracking soil biological activity, nutrient cycling rates, and crop performance provides the feedback necessary to adjust cover cropping strategies, organic amendments, or livestock integration to compensate for reduced synthetic fertility. This data-driven approach mitigates risks and ensures the soil biology can absorb the transition. For example, a farmer reducing nitrogen fertilizer by 30% would closely monitor crop growth and soil nitrogen tests, adjusting their cover crop mix to include more legumes or applying compost if needed.
Without systematic monitoring, regenerative agriculture principles can become abstract goals rather than verifiable achievements. The data generated from consistent observation provides the evidence base for adaptive management, allowing farmers to learn from their successes and failures, refine their strategies, and continually improve the ecological and economic resilience of their operations. It transforms farming from guesswork into a science-informed, artful practice.
Sources behind this view
Videos & Podcasts
-
Regenerative agriculture provides solutions for climate change, human health, and soil degradation, contrasting with industrial agriculture's harmful impacts, including glyphosate use. Practices like
-
Provides actionable steps for regenerative agronomy: balanced N:C inputs (molasses, humates), microbial teas, yeast metabolites, calcium, and effective seed treatments. Emphasizes scalability, systems
-
Case studies of farmers like Duane Beck, Kofi Boa, David Brandt, and Gabe Brown demonstrate that regenerative agriculture (no-till, cover crops, diverse rotations) significantly increases soil health,
-
Regenerative farming, using no-till, cover crops, and diverse rotations, rapidly rebuilds soil organic matter and soil life. Examples from Ohio and Ghana show these practices increase profitability by

 Community
-
Build healthy pasture soils by minimizing tillage, maintaining living roots and species diversity, and implementing proper grazing management. Livestock are essential for nutrient cycling and stimulat
Read more (opens in new window) smallfarms.cornell.edu -
Key takeaways for scaling regenerative agriculture include consistent certification standards, secure data sharing, long-term investment and financing, supply chain transparency, and collaborative eff
Read more (opens in new window) ucanr.edu -
Explains regenerative agriculture principles: no-till gardening to support soil microbiome and sequester carbon; using compost to reduce erosion and compaction; and planting diverse cover crops (grass
Read more (opens in new window) ucanr.edu -
Regenerative agriculture reverses soil harm by sequestering carbon through cover crops, no-till, compost, and crop rotation, improving soil health and resilience for both farms and home gardens.
Read more (opens in new window) ucanr.edu
Research
-
Systematic review of regenerative farming: Addressing agricultural sustainability challenges (opens in new window)
This study found: Systematic review of 31 studies shows regenerative farming improves soil health, biodiversity, and carbon capture, aiding sustainability. Technology is key for adoption, but policy, farmer understandi
-
Regenerative Agriculture: Restoring Ecosystems¢ Resilience and Productivity: A Review (opens in new window)
This study found: Regenerative agriculture builds soil health and ecosystem services through practices like no-till, cover crops, and diverse rotations. It increases soil organic matter, improves water infiltration, bo
-
The Indigenous Roots of Regenerative Agriculture (opens in new window)
This study found: Modern regenerative agriculture practices are rooted in millennia of Indigenous land stewardship, offering profound knowledge and a crucial value system of respect and reciprocity for true transformat
-
Regenerative Agriculture in the 21st Century: A Systematic Review of Environmental, Agronomic, and Socio-Economic Outcomes (opens in new window)
This study found: Systematic review finds Regenerative Agriculture boosts environment but faces yield gaps (16-21%) and socio-economic barriers. Advocates for resilience over maximum yields, needing financial support a
 From the Web
-
Key regenerative agriculture methods include no-till farming, cover cropping, agroforestry, perennial crops, planned rotational grazing (Holistic Management), and compost application, all aimed at imp
-
Five steps to regenerative agriculture: Holistic Planned Grazing, no-till farming, planting diverse cover crops/interseeding, using compost/inoculants (with caution), and incorporating silvopasture/wo
-
Regenerative agriculture is achievable by focusing on soil health through six principles: know your context, cover the soil, minimize disturbance, increase diversity, maintain living plants/roots, and
-
Regenerative agriculture restores soil health through practices like cover cropping and crop rotation, leading to carbon sequestration, increased resiliency, and reduced reliance on off-farm inputs, b
2
WHERE - Regional Considerations
Farm monitoring and record keeping is universally applicable, but the specific parameters monitored and the tools used will vary significantly based on regional climate, soil types, dominant enterprises, and available technology. The principles of observation and data...
Farm monitoring and record keeping is universally applicable, but the specific parameters monitored and the tools used will vary significantly based on regional climate, soil types, dominant enterprises, and available technology. The principles of observation and data collection remain constant, but their application must be localized.
WHERE - Regional Considerations
Farm monitoring and record keeping is universally applicable, but the specific parameters monitored and the tools used will vary significantly based on regional climate, soil types, dominant enterprises, and available technology. The principles of observation and data...
Farm monitoring and record keeping is universally applicable, but the specific parameters monitored and the tools used will vary significantly based on regional climate, soil types, dominant enterprises, and available technology. The principles of observation and data collection remain constant, but their application must be localized.
Click Here to Look up your Region if you don't already know it
Tropical Regions
Representative Locations: Southeast Asia (e.g., Indonesia, Vietnam), Central Africa (e.g., DRC, Ghana), Northern South America (e.g., Brazil, Colombia), Northern Australia (e.g., Queensland)
Climate Context: High temperatures year-round, with potential for high rainfall and distinct wet/dry seasons or consistent high humidity. Köppen Af/Am/Aw.
In tropical regions, monitoring often focuses on water management and rapid nutrient cycling. Key considerations include:
- Rainfall & Infiltration: Tracking intense monsoon rainfall is critical for managing erosion and preventing waterlogging. Monitoring infiltration rates helps assess soil structure's ability to handle heavy downpours.
- Nutrient Loss: Increased rainfall and temperatures can accelerate nutrient leaching. Monitoring soil nutrient levels and runoff quality is vital, especially after heavy rains or land disturbance.
- Pest & Disease Pressure: High humidity and warmth create ideal conditions for rapid pest and disease spread. Close monitoring of crops and livestock for early signs is essential.
- Soil Organic Matter (SOM): High temperatures can accelerate SOM decomposition. Monitoring SOM becomes crucial to ensure decomposition is balanced by inputs (cover crops, compost, manure).
- Cover Crop Effectiveness: Ensuring cover crops survive and thrive in humid, sometimes challenging conditions is key. Monitoring their growth, biomass production, and potential for weed suppression is important.
- Livestock Heat Stress: In tropical livestock systems, monitoring animal behavior, water intake, and body temperature is critical during periods of extreme heat.
Examples: Rice farmers in Vietnam monitor water levels in paddies, nutrient levels in floodwaters, and rice growth stages to optimize yields and water use. Cattle ranchers in Northern Australia track pasture growth rates, rainfall patterns, and livestock condition to manage stocking densities on vast rangelands.
Arid/Semi-Arid Regions
Representative Locations: Western USA (e.g., Nevada, Arizona), North Africa (e.g., Sahel region), Central Asia (e.g., Kazakhstan), Interior Australia
Climate Context: Low annual precipitation (<40 cm or 15 inches), high temperatures, short and often unpredictable growing season. Köppen BSh/BSk.
In arid and semi-arid regions, water conservation and efficient moisture use are paramount. Record keeping heavily emphasizes these aspects:
- Rainfall & Evaporation: Precise rainfall measurement and understanding evaporation rates are crucial for planning planting, irrigation, and grazing.
- Soil Moisture: Using soil moisture sensors at various depths provides critical data for irrigation scheduling and assessing drought risk.
- Water Infiltration & Runoff: Monitoring how quickly water enters the soil and the volume of runoff helps determine the effectiveness of measures to slow water and increase soil water holding capacity.
- Drought Resilient Cover Crops: Recording the performance of different cover crop species under drought stress helps select the most effective varieties for future cycles.
- Grazing Management: Monitoring pasture recovery and soil health under grazing is essential to avoid overgrazing and desertification in fragile environments. Rotational grazing plans are critically dependent on accurate pasture monitoring.
- Carbon Sequestration: In dryland areas, building SOM can be challenging but paramount. Tracking SOM changes over time is a key indicator of land health improvement.
Examples: Wheat farmers in Kazakhstan meticulously record rainfall, soil moisture, and crop yields to optimize dryland farming strategies. Ranchers managing extensive grazing lands in Western Australia monitor pasture growth and soil surface condition to adapt grazing plans to unpredictable rainfall.
Humid Temperate Regions
Representative Locations: Midwestern USA, Northern Europe (e.g., Germany, UK), Eastern China, Japan
Climate Context: Warm to hot summers and cool to cold winters with moderate to high annual precipitation (75-150 cm or 30-60 inches) distributed relatively evenly. USDA Zones 5-7, Köppen Cfb/Cfa.
These regions offer a balance of soil moisture and temperature, allowing for diverse cropping and grazing systems. Monitoring focuses on a broad spectrum of regenerative goals:
- Soil Organic Matter: With good moisture and temperature ranges, SOM can be effectively built. Regular monitoring of SOM levels, aggregate stability, and earthworm activity is key.
- Crop Rotation & Diversity: Tracking the sequence and diversity of cash crops and cover crops ensures maximum benefit from different root structures and nutrient cycles.
- Pest & Disease Cycles: Moderate temperatures and humidity can support significant pest and disease pressure. Monitoring helps predict and manage these cycles, reducing reliance on synthetic inputs.
- Nutrient Management: Understanding soil nutrient availability and crop uptake is crucial for efficient nutrient cycling and reducing fertilizer use.
- Pasture Management: For livestock operations, monitoring pasture growth rates, species composition, and recovery periods is vital for adaptive grazing.
Examples: Corn and soybean farmers in the US Midwest use GPS-enabled record keeping to track yields, soil types, and input applications, informing cover crop selection and reduced tillage practices. Mixed farmers in Europe monitor a complex web of crop rotations, livestock health, and soil fertility to maintain diverse, resilient systems.
Cold Continental Regions
Representative Locations: Northern USA and Canada, Northern Europe (e.g., Scandinavia), Northern Asia (e.g., Siberia)
Climate Context: Very short growing seasons, extreme summer heat, and severe winter cold. USDA Zones 3-5, Köppen Dfa/Dfb.
Monitoring in these regions prioritizes maximizing the short growing season and managing soil health through winter.
- Growing Season Length: Accurate tracking of frost dates, growing degree days, and effective solar radiation is critical for planting and harvest timing.
- Winter Soil Protection: Ensuring soil remains covered through winter (with snow or residue) is paramount to prevent erosion and maintain moisture for spring thaw. Monitoring residue levels and soil surface conditions is important.
- Cover Crop Selection for Cold Tolerance: Choosing cover crops that can survive or effectively mulch the soil through winter is key. Monitoring their establishment and winter survival is essential.
- Soil Warming & Drying: Tracking soil temperature and moisture spring thaw helps optimize planting windows.
- Livestock Winter Management: Monitoring feed intake, health, and shelter needs of livestock during extreme cold is vital.
Examples: Grain farmers in Saskatchewan, Canada, monitor snow depth and temperature to predict spring thaw and soil conditions for planting. Farmers in Sweden use soil temperature sensors to determine opportune planting windows for hardy grain varieties and cover crops.
Mediterranean Regions
Representative Locations: California, Mediterranean basin (e.g., Spain, Italy, Greece), Central Chile, Southwestern Australia
Climate Context: Hot, dry summers and mild, wet winters. Precipitation is highly seasonal. Köppen Csa/Csb.
Monitoring is heavily influenced by the distinct wet and dry seasons.
- Water Management: Highly critical. Monitoring rainfall in winter/spring, soil moisture during dry summer months, and irrigation needs is paramount.
- Drought Resilience: Selecting drought-tolerant cash crops and cover crops is key. Monitoring their performance and water use efficiency is crucial.
- Weed Management: Weeds can thrive in milder winter periods. Monitoring weed populations and developing integrated management strategies is important.
- Soil Health & Erosion Control: Intense winter rains on dry, often sloped land can cause severe erosion. Monitoring soil cover and infiltration is vital.
Examples: Grape growers in Spain monitor vine growth, soil moisture, and grape quality. Farmers in California's Central Valley use sophisticated irrigation monitoring systems to optimize water use for crops like almonds and tomatoes, while also integrating cover crops to build soil health during the off-season.
Subtropical Regions
Representative Locations: Southeastern USA, Southern China, Southern Brazil, Eastern Australia
Climate Context: Hot, humid summers and mild winters with generally ample rainfall, though tropical storms can occur. USDA Zones 9-11, Köppen Cfa/Cwa.
Monitoring in these regions balances managing high humidity, intense rainfall, and occasional heat stress.
- Disease Management: High humidity and temperature create ideal conditions for fungal pathogens. Close monitoring of crop health and weather patterns is needed to predict and manage disease outbreaks.
- Soil Erosion: Heavy rainfall events can cause significant erosion. Monitoring soil cover and infiltration rates is vital.
- Cover Crop Duration: Selecting cover crops that can grow through mild winters and extend living roots and soil cover is beneficial.
- Heat Stress: For livestock and certain crops, monitoring extreme heat events and providing relief is important.
Examples: Cotton growers in Southern Brazil monitor soil moisture, pest pressure, and crop development to manage intensive growing seasons. Mixed farmers in Eastern Australia track rainfall, pasture growth, and potential for disease in their diverse crop and livestock systems.
3
HOW - Implementation Process
Farm monitoring and record keeping is not a single activity but a continuous process that can be phased in and adapted to the farm's specific needs, resources, and goals. The complexity can range from simple to highly sophisticated, but the core principles of...
Farm monitoring and record keeping is not a single activity but a continuous process that can be phased in and adapted to the farm's specific needs, resources, and goals. The complexity can range from simple to highly sophisticated, but the core principles of observation, measurement, and documentation remain the same.
HOW - Implementation Process
Farm monitoring and record keeping is not a single activity but a continuous process that can be phased in and adapted to the farm's specific needs, resources, and goals. The complexity can range from simple to highly sophisticated, but the core principles of...
Farm monitoring and record keeping is not a single activity but a continuous process that can be phased in and adapted to the farm's specific needs, resources, and goals. The complexity can range from simple to highly sophisticated, but the core principles of observation, measurement, and documentation remain the same.
Prerequisites
Before commencing systematic monitoring, consider these prerequisites:
- Define Goals: What do you want to achieve with monitoring? Improve soil health? Reduce input costs? Increase yields? Prove regenerative practices? Clear goals will guide your data collection.
- Assess Resources: What time can you dedicate? What budget is available for tools or software? What existing technology (smartphone, computer) do you have?
- Understand Your Farm: Have a basic understanding of your soil types, main enterprises, historical management, and unique regional challenges.
Phase 1: Manual Observation & Basic Record Keeping (Months 1-6, Continuous)
This phase is low-tech and relies on consistent manual observation. It's ideal for farms with limited resources or those just starting with a regenerative transition.
- Tools: A field notebook and pen, a smartphone with a camera, and a basic spreadsheet program (e.g., Google Sheets, Excel).
-
Activities:
- Daily Farm Walk-Throughs: Dedicate 15-30 minutes each day to walk fields and pastures. Note observations: plant vigor, pest presence, weed types, animal behavior, soil surface condition (bare soil, residue, moisture). Take photos of interesting findings.
- Record Key Events: Immediately jot down significant events: planting dates, weather extremes (heavy rain, frost), pest outbreaks, irrigation started/stopped, livestock moved, repairs made.
- Simple Spreadsheets: Create basic spreadsheets for:
- Field Log: Date, Field Name, Activity, Observations, Yield (if applicable).
- Input Log: Date, Input Type, Quantity, Cost, Application Rate/Location.
- Weather Log: Daily Temperature (min/max), Rainfall (mm or inches).
-
International Context: A farmer in rural Kenya might use a waterproof notebook and a basic flip phone camera for daily observations. A farmer in Canada might use a tablet with a spreadsheet app. The core is capturing observations consistently.
- Cost: Minimal ($0-20 USD equivalent for notebook and pen).
Phase 2: Structured Data Collection & Regular Review (Months 6-18, Continuous)
This phase introduces more structured data collection and regular analysis. It builds upon Phase 1 by standardizing data entry and incorporating regular review.
- Tools: Field notebook, smartphone, spreadsheet software, simple measuring tools (rain gauge, soil thermometer, soil probe for approximate moisture/compaction), soil sampling kits.
-
Activities:
- Standardize Field Notes: Use pre-defined templates in your notebook or a basic digital form for field observations, ensuring key metrics are always recorded (e.g., "Date, Field, Crop/Cover, Avg. Height, Weed Cover %, Pest %, Disease %, Soil Moisture (1-5 scale)").
- Regular Soil Sampling: Conduct basic soil tests annually or bi-annually. Focus on key organic matter, pH, and major nutrient levels. Note sampling dates and locations.
- Measure Key Metrics: Record specific measurements:
- Rainfall (using a calibrated rain gauge).
- Soil temperature at planting depth.
- Approximate soil moisture (e.g., by feel or simple probe).
- Pasture growth rates (e.g., clipping a known area periodically).
- Monthly Data Review: Set aside 1-2 hours each month to review the past month's records. Look for trends, anomalies, and connections. E.g., "Did heavy rain lead to increased weed pressure?" or "Did cover crop X perform better in Field Y?".
- Yield Mapping (Basic): If you have GPS on your combine or spreader, start creating basic yield maps or input application maps. Even simple hand-drawn maps indicating high/low yield areas can be valuable.
-
International Context: In regions with limited access to advanced soil testing labs, farmers might rely on more visual indicators and simpler tests, calibrated to local conditions. Extension services in many countries offer basic soil testing kits or guidance.
- Cost: $50-300 USD equivalent (for soil tests, basic measuring tools, potentially a more robust spreadsheet template).
Phase 3: Integrated Data Management & Analysis (Months 18+, Continuous)
This phase leverages digital tools and more advanced analysis to create a comprehensive farm management system.
- Tools: Farm management software (FMS), GPS-enabled equipment, drone imagery, soil sensors (moisture, temperature), weather stations, professional soil testing labs.
-
Activities:
- Farm Management Software (FMS): Utilize FMS platforms (e.g., Agrivi, Cropio, Farmo, or specialized platforms) to centralize all farm data: field activities, inputs, yields, financial data, soil test results, weather, livestock records. This allows for cross-referencing and detailed analysis.
- Precision Technology: Use GPS for auto-steering, variable rate application, and precise record keeping of operations. Monitor yield variability across fields.
- Remote Sensing: Employ drones or satellite imagery to monitor crop health, vegetative indices (NDVI), soil moisture variability, and identify problem areas across large fields efficiently.
- Advanced Soil Testing: Work with professional labs for detailed nutrient analysis, biological assays (e.g., Haney test for biological activity), and detailed soil structure assessments.
- Regular Strategic Review: Conduct quarterly or semi-annual reviews using FMS reports. Analyze trends over multiple years, benchmark performance, and adjust regenerative strategies based on data. Example: "Since implementing cover crops, soil organic matter has increased by 0.5% in Field A, and crop yields have improved by 12% over three years. Let's expand cover cropping to Field B."
- Financial Literacy: Integrate financial records with operational data to understand the true cost of production, profitability per field, and return on investment for regenerative practices.
-
International Context: Access to advanced FMS and precision agriculture technology varies greatly. Remote sensing (drone/satellite) is becoming more accessible globally through subscription services. Internet connectivity is a key factor. In remote areas, simpler data aggregation might still be necessary. Government extension services or regional agricultural organizations can advise on available local technologies.
- Cost: $200 - $5,000+ USD equivalent annually for FMS subscriptions, sensor networks, or mapping services, depending on farm size and complexity.
Transition Timeline & Phase-Out Strategy
Farm monitoring is critical for managing the transition to regenerative practices, particularly regarding input reduction.
- Year 1-2 of Transition: Focus on establishing baseline data. Record all current input usage and standard operational metrics. Implement cover cropping or improved grazing management.
- Year 2-4: Begin gradual input reduction (e.g., 10-20% reduction in synthetic nitrogen or pesticides). Monitor crop performance, soil biology, and pest pressure closely. If performance dips, adjust cover crop strategies, soil amendments, or livestock integration to support the soil. Data shows if reductions are sustainable.
- Year 4-7: Continue gradual input reduction (another 20-40%). Monitor for improvements in soil health (SOM, infiltration) and crop resilience. If soil biology is robust, it can often compensate for reduced synthetic inputs.
- Year 7+: Aim for near elimination of synthetic inputs. Transition complete when soil health metrics (e.g., soil respiration, plant-available nutrients from biology, aggregate stability) indicate a functionally regenerative system that meets crop needs. The record-keeping shifts from monitoring reduction to monitoring optimization of regenerative outputs.
Success Indicators for Regenerative Transition:
- Consistent year-on-year improvement in key soil health indicators (SOM, infiltration, aggregate stability).
- Stable or increasing crop/livestock yields with reduced synthetic inputs.
- Increased resilience to drought, pests, and diseases.
- Thriving soil biological indicators (high earthworm counts, diverse microbial activity).
- Improved financial performance due to reduced input costs and improved productivity.
Sources behind this view
Videos & Podcasts
-
Transitioning to regenerative agriculture is a human/psychological process requiring trials to reduce risk and build trust. Increased consumer awareness of ecology and health would drive demand for re
-
Soil Capital's strategy for regenerative transition: 1) Optimize agrochemical/pesticide use for 10-40% savings. 2) Invest savings in multi-species cover crops and crop rotation diversification (oats,
-
Regenerative agriculture provides solutions for climate change, human health, and soil degradation, contrasting with industrial agriculture's harmful impacts, including glyphosate use. Practices like
-
Case studies of farmers like Duane Beck, Kofi Boa, David Brandt, and Gabe Brown demonstrate that regenerative agriculture (no-till, cover crops, diverse rotations) significantly increases soil health,
Community
-
Key takeaways for scaling regenerative agriculture include consistent certification standards, secure data sharing, long-term investment and financing, supply chain transparency, and collaborative eff
Read more (opens in new window) ucanr.edu -
Advocates for converting conventional land to permaculture, recommending a gradual transition with cover crops and farmer collaboration, aiming to reduce chemical inputs over 3 years as soil heals.
Read more (opens in new window) permies.com
Research
-
Systematic review of regenerative farming: Addressing agricultural sustainability challenges (opens in new window)
This study found: Systematic review of 31 studies shows regenerative farming improves soil health, biodiversity, and carbon capture, aiding sustainability. Technology is key for adoption, but policy, farmer understandi
-
Regenerative Agriculture: Restoring Ecosystems¢ Resilience and Productivity: A Review (opens in new window)
This study found: Regenerative agriculture builds soil health and ecosystem services through practices like no-till, cover crops, and diverse rotations. It increases soil organic matter, improves water infiltration, bo
-
Transition to Regenerative Farming (opens in new window)
This study found: A 5-year case study shows a farm successfully transitioned to regenerative practices, reducing soil erosion and increasing wildlife by using cover crops, diversified rotations, and reduced tillage. Pr
-
The Indigenous Roots of Regenerative Agriculture (opens in new window)
This study found: Modern regenerative agriculture practices are rooted in millennia of Indigenous land stewardship, offering profound knowledge and a crucial value system of respect and reciprocity for true transformat
From the Web
-
Five steps to regenerative agriculture: Holistic Planned Grazing, no-till farming, planting diverse cover crops/interseeding, using compost/inoculants (with caution), and incorporating silvopasture/wo
4
Know the Debate
Farm monitoring and recordkeeping is essential globally, adapted to local conditions. Tropical regions focus on water and disease, while arid zones...
Know the Debate
Farm monitoring and recordkeeping is essential globally, adapted to local conditions. Tropical regions focus on water and disease, while arid zones...
Farm monitoring and recordkeeping is essential globally, adapted to local conditions. Tropical regions focus on water and disease, while arid zones prioritize moisture conservation. Temperate and subtropical climates manage broader soil health and pest cycles, with cold regions emphasizing short seasons and winter protection. The 'how' involves a phased approach, from simple manual observation to advanced digital systems, with costs and labor varying by scale and technology investment.
How much does farm monitoring cost at different scales?
Small Scale ($13-40/ha) - DIY focused
Small farms can start with minimal investment using notebooks, spreadsheets, and basic apps. Costs are primarily for annual soil tests and the farmer's time, making it accessible for low-margin operations.
Sources behind this view
Sources behind this view
Videos & Podcasts
-
Market farms need software for tracking expenses/income, sales (POS), and production. Spreadsheets can be a starting point, but dedicated software offers integrated solutions. Organic certification requires detailed record-keeping.
-
Small farms often excel at food safety practices but lack documentation. Key improvements include record-keeping for worker training and organized systems. An On-Farm Readiness Review is recommended for identifying compliance gaps.

From the Web
-
Practical monitoring includes soil checks with a shovel (spring) and observing litter dams (fall/winter), plant vigor, seedling survival, and using grazing exclosures. Livestock contentment and hoof action are key indicators, supported by photo points for documenting progress.
Mid Scale ($50-200/ha) - Integrated Tech
Mid-scale farms balance cost and comprehensiveness with entry-level farm management software, regular soil tests, and moderate satellite imagery subscriptions.
Sources behind this view
Sources behind this view
Videos & Podcasts
-
Data from 1,600+ farms show regenerative practices reduce feed/vet costs by 40%, increase forage/organic matter, and improve arable efficiency. Soil health is the foundation for profitability, making it a necessity, not a choice.

From the Web
-
Details record-keeping methods for urban farms, including shoebox accounting, the Cornell Farm Account Book, Excel spreadsheets, and professional Farm Records Services, emphasizing tax compliance and business decision-making.
-
A checklist of resources for regenerative grazing and soil health, including management knowledge, organizations (NCAT/ATTRA, Holistic Management International), planning tools (Pasture Map, Maia Grazing), and soil monitoring equipment (penetrometer, infiltrometer).
Large Scale ($200-1000+/ha) - Advanced Systems
Large-scale operations benefit from comprehensive farm management software, advanced sensors, and high-resolution imagery, which amortize costs over vast acreage and enable significant operational efficiencies.
Sources behind this view
Sources behind this view
Videos & Podcasts
-
Scientific interest in regenerative agriculture data collection has surged, with institutes collaborating to gather data for developing software and machines to enable economically feasible, ecosystem-conscious farming.
-
Century is integrating soil disturbance reduction (saving £30-£100+/hectare), cover crops, and input reduction (improving nitrogen use efficiency to 92%) across its farms, utilizing grants and exploring livestock integration, while emphasizing gradual, profitable transitions.

-
Monetizing regenerative practices requires initial baselining and measurement using tools like RegenAgri's scorecard and emissions data tracking. The process involves continuous improvement through audits and certification, focusing on demonstrating actual regeneration.
Making Sense of the Differences
The cost of farm monitoring scales significantly with operation size and technology adoption. Small farms can leverage low-cost tools and manual observation, while larger operations benefit from integrated software and sensors that reduce labor costs per hectare. Entry costs range widely, from minimal for DIY to substantial for advanced systems, influencing practicality based on farm budget and labor availability.
How quickly does monitoring add value during regenerative transition?
Immediate Insight & Risk Mitigation (1-2 years)
Basic observations and structured logging provide immediate awareness of field conditions, pest pressures, and operational anomalies, enabling quick adaptation and preventing minor issues from escalating.
Sources behind this view
Sources behind this view
Videos & Podcasts
-
Monitor plant health, soil texture/moisture/organic matter, water harvesting system performance, wildlife diversity, crop/livestock yields, and weather patterns to track homestead progress and refine practices.

-
Farmers should regularly dig holes to monitor soil health and biology, using tools like the Sector Mentor app for consistent observation and problem identification.
From the Web
-
This section emphasizes monitoring as crucial for grazing plan success, covering soil health (shovel, infiltration, slake tests), forage productivity (photo transects, clip-and-weigh), and animal behavior/production. Financial assessment is also included to track profitability.
Developing Trends & Adaptation (3-5 years)
Consistent data collection over several years allows identification of emerging trends in soil health, input efficiency, and yield responses, guiding gradual adjustments to management practices.
Sources behind this view
Sources behind this view
Videos & Podcasts
-
Data from 1,600+ farms show regenerative practices reduce feed/vet costs by 40%, increase forage/organic matter, and improve arable efficiency. Soil health is the foundation for profitability, making it a necessity, not a choice.
-
Transitioning to regenerative agriculture requires a whole-systems mindset, focusing on soil health principles: reduce tillage/compaction, increase diversity (plants, animals), eliminate bio-cides/fertilizers. Plan transitions gradually, involve employees, monitor changes, and understand that soil regeneration is a long-term process.

From the Web
-
Details ongoing record-keeping for organic certification and business monitoring, emphasizing tracking labor, equipment, and sales. It outlines using monitoring checkpoints with specific timelines for land acquisition, transition, and certification in South Dakota and Minnesota, and recommends using Worksheets 5T.1 and 5T.2.
Significant Economic & Ecological Gains (5-7+ years)
Long-term data analysis reveals compounding benefits like substantial input cost reductions, yield optimization, and measurable soil health improvements, solidifying the economic and ecological case for regenerative agriculture.
Sources behind this view
Sources behind this view
Videos & Podcasts
-
Data from 1,600+ farms show regenerative practices reduce feed/vet costs by 40%, increase forage/organic matter, and improve arable efficiency. Soil health is the foundation for profitability, making it a necessity, not a choice.
-
Adopting regenerative practices should start small and incrementally, focusing on soil health over short-term yields. Collaboration, strategic nutrient sourcing, and leveraging resources like Continuum Ag are key to successful implementation.
From the Web
-
A farmer's logbook template for documenting crop, tree, and livestock management, including techniques, fertilizer/pest control, benefits to soil and income, and weather impacts, promoting observation and social learning.
Making Sense of the Differences
The value of monitoring during regenerative transition unfolds over time. Initial observations offer immediate risk mitigation and situational awareness. Consistent data collection over 3-5 years reveals trends and supports adaptive management. Significant economic and ecological benefits, such as substantial input reductions and yield improvements, typically manifest after 5-7 years of dedicated monitoring and practice refinement.
5
HOW MUCH - Costs & Investment
Note: Costs are approximate and primarily based on US market pricing (2023-2025). They represent an investment in data acquisition and management. Costs vary significantly by region due to labor rates, technology availability, and local currency exchange rates. Multiply...
Note: Costs are approximate and primarily based on US market pricing (2023-2025). They represent an investment in data acquisition and management. Costs vary significantly by region due to labor rates, technology availability, and local currency exchange rates. Multiply baseline USD costs by local indices for materials and labor.
HOW MUCH - Costs & Investment
Note: Costs are approximate and primarily based on US market pricing (2023-2025). They represent an investment in data acquisition and management. Costs vary significantly by region due to labor rates, technology availability, and local currency exchange rates. Multiply...
Note: Costs are approximate and primarily based on US market pricing (2023-2025). They represent an investment in data acquisition and management. Costs vary significantly by region due to labor rates, technology availability, and local currency exchange rates. Multiply baseline USD costs by local indices for materials and labor.
Note: All costs are based on recent US economic data (2024–2026) and may vary substantially by region based on local labor rates, material costs, and regulatory requirements.
Data Acquisition & Physical Tools
Physical monitoring requires initial and recurring outlays for hardware designed to capture environmental, chemical, and biological performance metrics. Small-scale operations (under 50 acres (20 ha)) face higher per-acre costs due to the lack of economy of scale, with hardware investments ranging from $21–$63 per acre ($52–$156/ha). These operations typically utilize manual weather stations, soil probes, and notebook-based record keeping, often purchasing tools individually which lacks volume discounts. Mid-size operations (50–500 acres (20–202 ha)) typically transition to standardized soil testing kits and shared equipment, with costs ranging from $10–$31 per acre ($25–$77/ha). Finally, large-scale operations (500+ acres) leverage bulk laboratory contracts and investment in automated, telemetric soil moisture and nutrient sensors, keeping per-acre investment lower at $5–$16. The high initial overhead for large operations is offset by drastically reduced labor requirements per unit of data collected.
Data Management Software & Professional Services
Digital infrastructure shifts the cost burden from manual hardware upkeep to subscription-based services. Small-scale producers often utilize free or "freemium" spreadsheet models and low-cost mapping applications to track inputs, with annual software-related budgets of $21–$104 per acre ($52–$257/ha). Mid-size producers commonly pay for professional-grade Farm Management Software (FMS) tiers, which offer automated reporting and enterprise-level dashboarding, costing $62–$156 per acre ($153–$385/ha). Large-scale producers utilize enterprise-level packages including high-resolution satellite imagery integration, yield monitoring mapping, and third-party consultant audits. These comprehensive ecosystems command a price tag of $156–$313 per acre ($385–$773/ha), providing the actionable intelligence required to manage thousands of acres through data-driven intervention.
Labor Investment
Labor is the most significant "hidden" cost of record keeping. Based on rural wage indices, labor is valued at $25–$37 per hour. Small-scale operations require approximately 2.5–5 hours per week to maintain logs, valuing total annual labor at $3,387–$9,482 per year. Mid-size operations, which require higher precision for insurance and certification compliance, spend 5–9 hours weekly, totaling $6,773–$17,068 annually. Large-scale operations dedicated to data integration and continuous improvement monitoring report 8–15 hours of management time per week, with an annual labor valuation of $8,336–$15,630. While these labor costs are often "absorbed" by the owner-operator, they represent a significant diversion of time that could be allocated elsewhere.
Most Spend: Most agricultural operations fall within a moderate annual investment of $45–$115 per acre ($111–$284/ha). This middle 60% range reflects the cost of standardized, mid-tier digital subscriptions combined with professional, third-party laboratory soil fertility testing services and balanced management time.
Why the Range?: Costs vary due to the "digitization gap"—the degree to which an operation automates data collection versus doing so manually. Higher costs are driven by the implementation of proprietary smart-sensor networks and enterprise software packages, while low-end range figures are achieved through labor-intensive self-reporting and the use of government-subsidized university testing services.
6
REWARDS AND RISKS - Economics & Risk Factors
Economic Scenarios
Economic Scenarios
REWARDS AND RISKS - Economics & Risk Factors
Economic Scenarios
Economic Scenarios
Economic Scenarios
- Best Case Scenario: Within 3–5 years, precise record keeping facilitates significant input optimization. By refining fertilizer application based on exact data, operations reduce input expenditures by 15–25% (worth $83–$156 per acre ($205–$385/ha)). Increased efficiency prevents 5–10% output losses, adding $52–$156 per acre ($128–$385/ha) in net profit. Combined with "verified regenerative" market premiums, the total net benefit reaches $135–$312 per acre ($334–$771/ha) annually by Year 5.
- Typical Case Scenario: Over 5–7 years, management improvements through rotation optimization yield a 10–15% input cost reduction. By amortizing risk mitigation (e.g., catching nutrient deficiencies early to prevent yield collapse), an operation saves approximately $104–$208 per acre ($257–$514/ha) annually. Systems generally achieve break-even status by Year 3 as management efficiencies compound.
- Worst Case Scenario: If data is collected but never integrated into management decisions, the expense represents a total capital loss. Costs accrue at $52–$156 per acre ($128–$385/ha) for software/tools, while yield performance remains stagnant. When combined with the high opportunity cost of labor—estimated at $208–$832 per acre ($514–$2,056/ha) in lost management time—the operation incurs significant net drag on profitability.
Market Factors & Risk Mitigation Record keeping serves as a critical financial hedge. Precise cost-of-production data allows producers to forward-contract grains or livestock with confidence, shielding the business from unexpected commodity price volatility. To mitigate against technical obsolescence, producers must prioritize "open-API" software; proprietary software "vendor lock-in" can create migration costs of $520–$2,080 if the provider goes offline or changes pricing models. Furthermore, satisfying private audit requirements via documented history enables access to premium markets, potentially capturing a 5–15% revenue increase over conventional commodity pricing.
Transition Period Risks Moving to intensive monitoring often involves a 2-year "normalization" phase. During this transition, a farm may experience a 5–10% yield dip as biological systems adjust to reduced synthetic inputs, creating a temporary revenue drag of $42–$104 per acre ($104–$257/ha). This risk is best mitigated by maintaining a "legacy baseline"—keeping 10% of total acreage under traditional management to prevent catastrophic total loss—and prioritizing low-capital, biology-focused monitoring before scaling expensive digital hardware infrastructure.
Sources behind this view
Videos & Podcasts
-
Track harvest yield per bed, revenue per labor hour, and make specific timing adjustments based on field observations. This data-driven approach optimizes crop decisions, especially during shoulder se
-
Transitioning to regenerative farming costs $75k-$140k over two years but saves money compared to conventional nitrogen expenses ($195k/year). Start small (50-100 acres) with cover crops (hairy vetch,
-
Explains scenario planning using transition, low, base, and high cases over 10 years to model yield and price variability, akin to Monte Carlo analysis. It also covers fixed costs like organic certifi
Research
-
Identifying Risk-Efficient Crop Portfolios for Different Cropping Systems by Analyzing the Tradeoffs Between Arable Farming Profits and Profit Stability (opens in new window)
This study found: Crop choices significantly impact farm income stability. Organic farming can be profitable but riskier. Grains reduce risk; potatoes/sugar beets increase it. Pesticide-free systems with synthetic fert
7
COMPATIBLE PRACTICES - Integration Opportunities
Farm monitoring and record keeping is not a standalone practice but an enabler for many other regenerative practices. It provides the feedback loop necessary for these practices to be effective, adaptive, and ultimately successful.
Farm monitoring and record keeping is not a standalone practice but an enabler for many other regenerative practices. It provides the feedback loop necessary for these practices to be effective, adaptive, and ultimately successful.
COMPATIBLE PRACTICES - Integration Opportunities
Farm monitoring and record keeping is not a standalone practice but an enabler for many other regenerative practices. It provides the feedback loop necessary for these practices to be effective, adaptive, and ultimately successful.
Farm monitoring and record keeping is not a standalone practice but an enabler for many other regenerative practices. It provides the feedback loop necessary for these practices to be effective, adaptive, and ultimately successful.
- Cover Cropping (⭐⭐⭐⭐⭐ Essential): Monitoring confirms the success of cover crops by tracking their growth, biomass production, soil cover duration, and impact on soil health indicators (e.g., infiltration, SOM). It helps select the best cover crop species for specific field conditions and regenerative goals.
- Rotational & Adaptive Grazing (⭐⭐⭐⭐⭐ Essential): Monitoring pasture growth rates, botanical composition, recovery periods, and soil surface conditions is fundamental to designing and executing effective grazing plans. It allows for real-time adjustments based on environmental conditions and animal impact.
- No-Till Farming (⭐⭐⭐⭐⭐ Essential): Monitoring soil compaction, aggregate stability, and earthworm activity verifies the benefits of no-till and identifies areas where unintended compaction might still occur, guiding adjustments in traffic management.
- Composting & Organic Amendments (⭐⭐⭐⭐ High Synergy): Tracking application rates, locations, and the subsequent impact on soil organic matter, nutrient levels, and crop performance helps optimize amendment use and quantify their value.
- Intercropping & Polycultures (⭐⭐⭐⭐ High Synergy): Record keeping tracks the performance of diverse crop systems, helping farmers understand species interactions, optimize planting densities, and measure the synergistic benefits on yield, pest control, and soil health.
- Water Management Systems (e.g., Keyline, Irrigation) (⭐⭐⭐⭐ High Synergy): Monitoring rainfall, soil moisture, and water runoff or usage provides data to optimize water infiltration, storage, and application, ensuring efficient use and preventing erosion.
- Pest & Disease Integrated Management (⭐⭐⭐ Moderate Synergy): Monitoring pest/disease pressure, beneficial insect populations, and weather patterns informs timely, targeted interventions, reducing reliance on broad-spectrum pesticides.
- Carbon Farming & Sequestration Projects (⭐⭐⭐ Moderate Synergy): Detailed historical records and ongoing monitoring of soil organic matter, soil respiration, and land use changes provide the data needed to quantify carbon sequestration for potential carbon credits or ecosystem service payments.
- Livestock Health Management (⭐⭐⭐ Moderate Synergy): Tracking animal health, feed conversion, and manure distribution helps optimize livestock diets, reduce disease incidence, and ensure manure is utilized effectively as a soil fertility input.
The synergy rating reflects how directly and significantly monitoring enhances the effectiveness of the compatible practice. For example, without monitoring, cover crops might be planted without certainty of their success or full benefits. With monitoring, cover crop selection can be refined, success can be verified, and their contribution to soil health can be quantified. Ultimately, record keeping provides the feedback loop that makes all other regenerative practices truly adaptive and responsive to the specific context of the farm.
Sources behind this view
Videos & Podcasts
-
Regenerative agriculture provides solutions for climate change, human health, and soil degradation, contrasting with industrial agriculture's harmful impacts, including glyphosate use. Practices like
-
Provides actionable steps for regenerative agronomy: balanced N:C inputs (molasses, humates), microbial teas, yeast metabolites, calcium, and effective seed treatments. Emphasizes scalability, systems
-
Case studies of farmers like Duane Beck, Kofi Boa, David Brandt, and Gabe Brown demonstrate that regenerative agriculture (no-till, cover crops, diverse rotations) significantly increases soil health,
-
Adopting regenerative practices should start small and incrementally, focusing on soil health over short-term yields. Collaboration, strategic nutrient sourcing, and leveraging resources like Continuu
Research
-
Systematic review of regenerative farming: Addressing agricultural sustainability challenges (opens in new window)
This study found: Systematic review of 31 studies shows regenerative farming improves soil health, biodiversity, and carbon capture, aiding sustainability. Technology is key for adoption, but policy, farmer understandi
-
Regenerative Agriculture: Restoring Ecosystems¢ Resilience and Productivity: A Review (opens in new window)
This study found: Regenerative agriculture builds soil health and ecosystem services through practices like no-till, cover crops, and diverse rotations. It increases soil organic matter, improves water infiltration, bo
-
The Indigenous Roots of Regenerative Agriculture (opens in new window)
This study found: Modern regenerative agriculture practices are rooted in millennia of Indigenous land stewardship, offering profound knowledge and a crucial value system of respect and reciprocity for true transformat
-
Regenerative Agriculture: Insights and Challenges in Farmer Adoption (opens in new window)
This study found: Review of 7 regenerative agriculture practices (no-till, crop rotation, cover crops, etc.) highlights benefits and key adoption challenges like cost, farm size, and institutional barriers for scalable